Handling a new dataset 📅 Sep 23, 2021 · 🕘 12 min read · 🤖 Matteo Miotto Let's see what operations to perform when you are faced with a new dataset
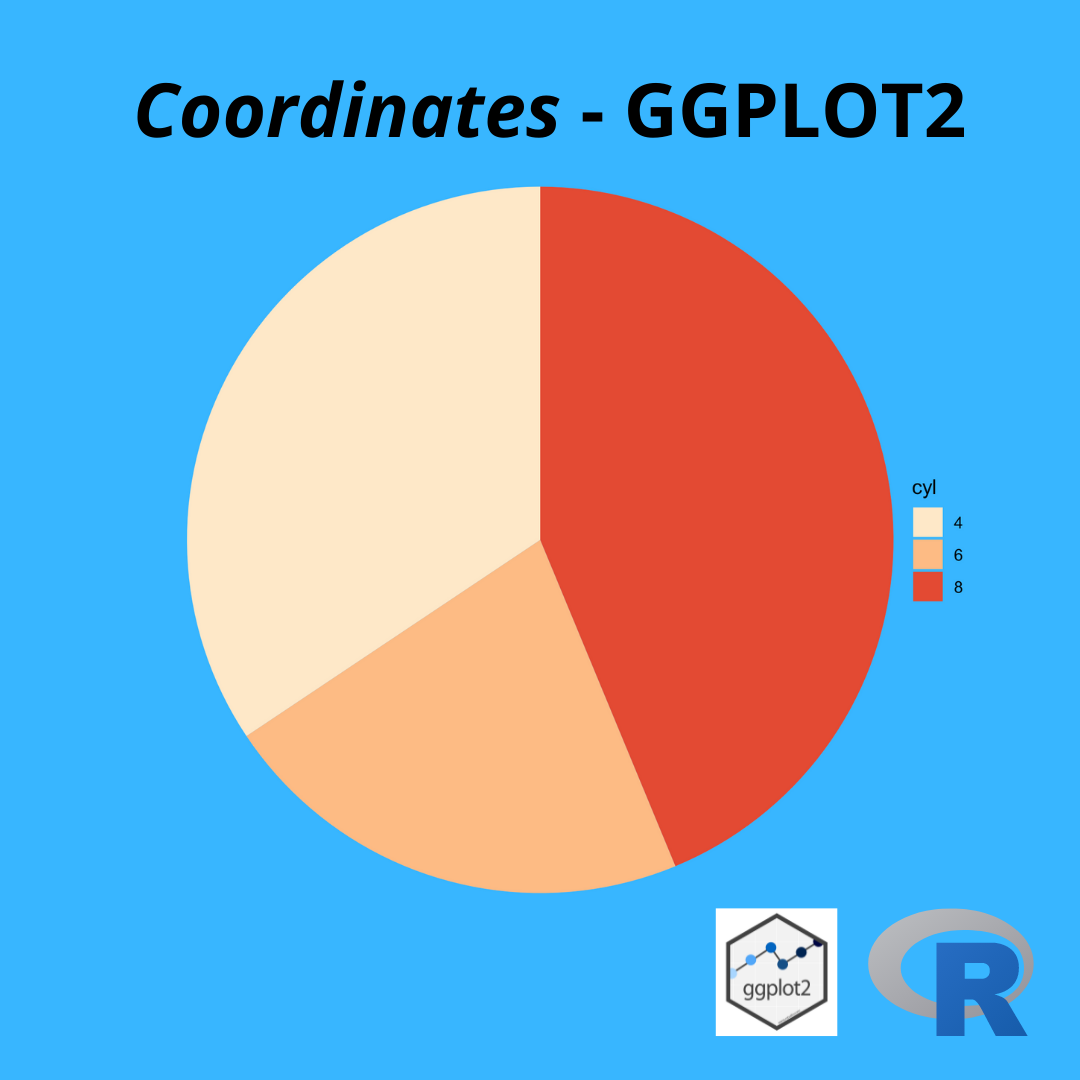
GGPLOT2 coordinates 📅 Jul 6, 2021 · 🕘 5 min read · 🤖 Matteo Miotto Coordinate function in ggplot2: change axes aspect and create a pieplot
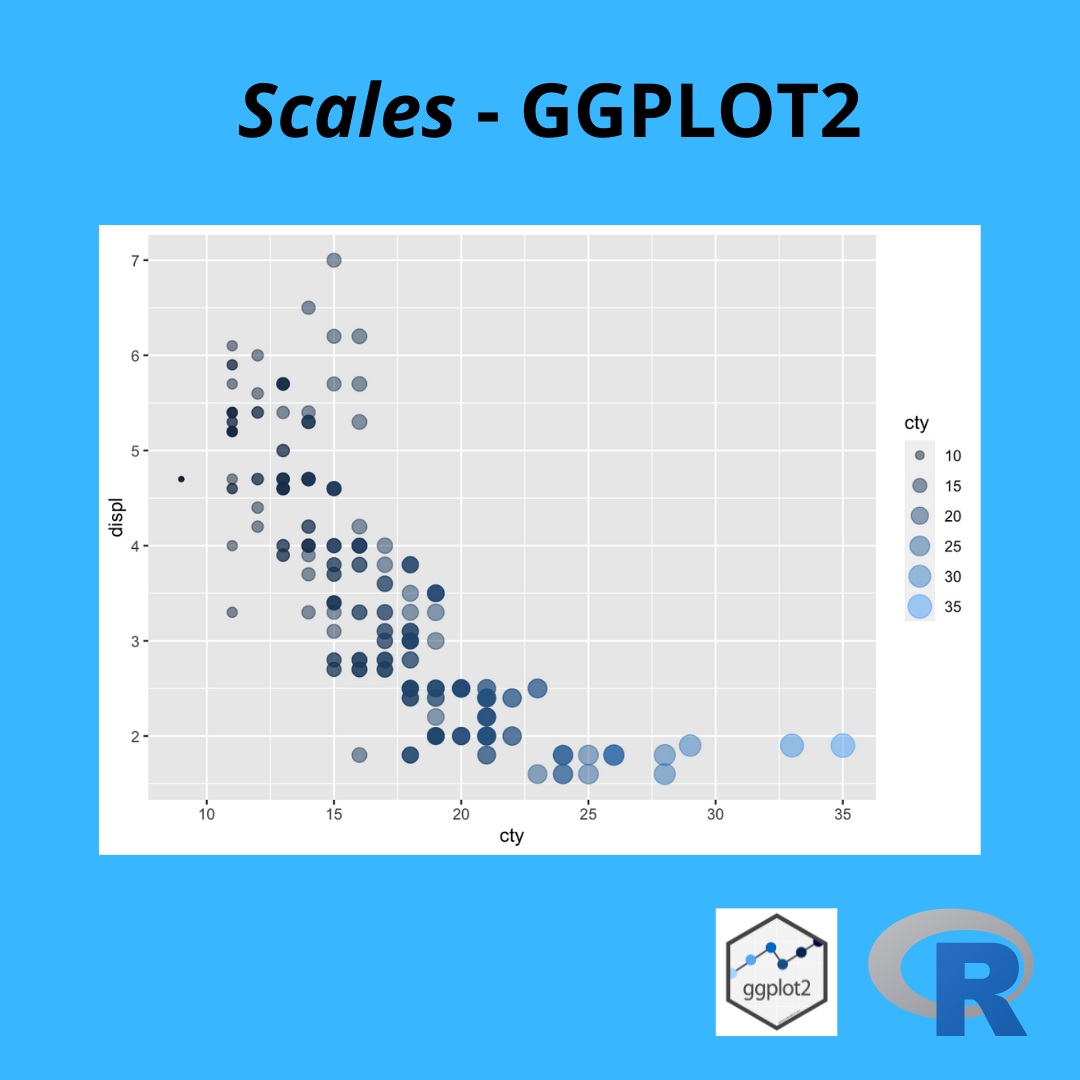
GGPLOT2 scales 📅 May 19, 2021 · 🕘 4 min read · 🤖 Matteo Miotto Scales function in ggplot2: setting aesthetics mapping
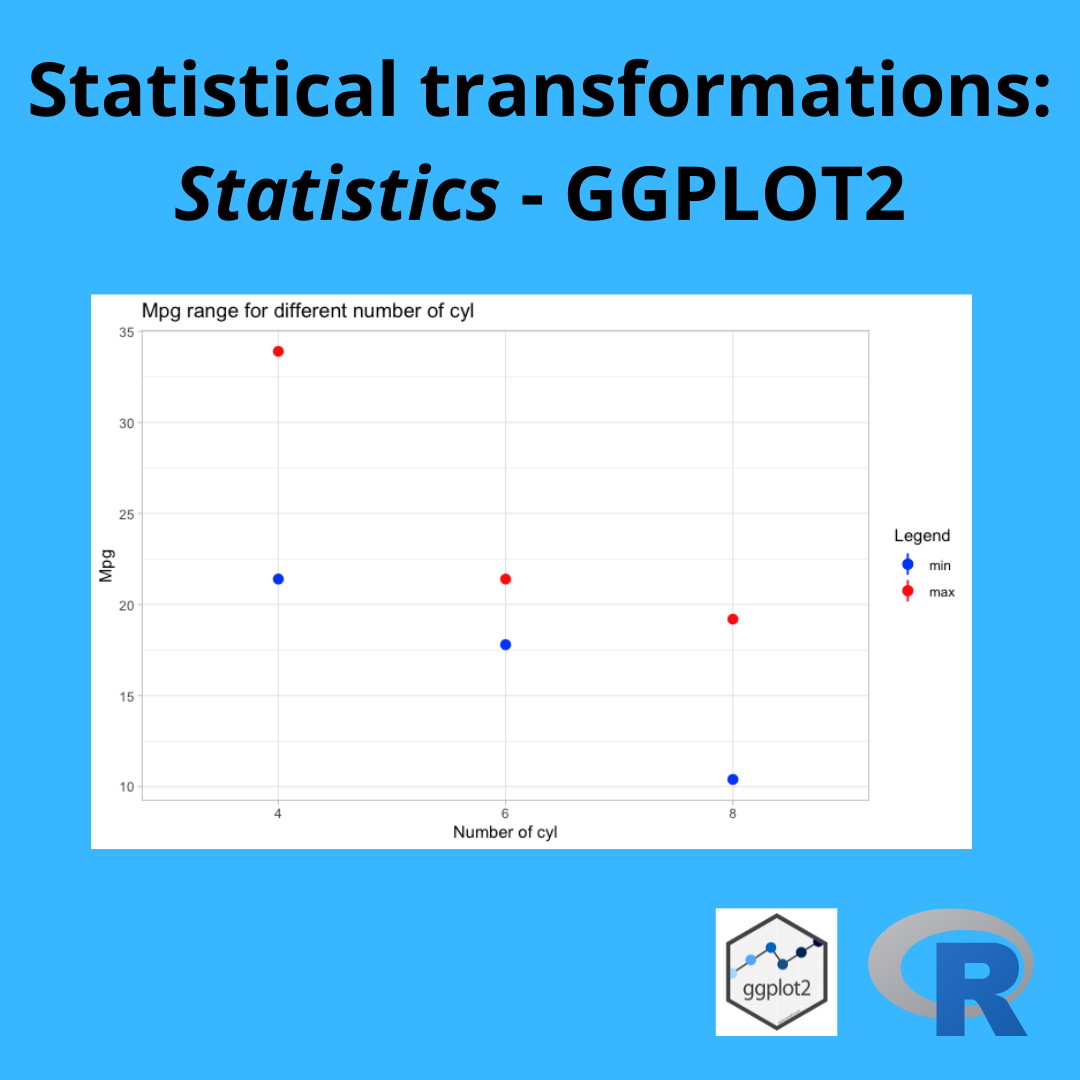
GGPLOT2 statistics 📅 Apr 21, 2021 · 🕘 5 min read · 🤖 Matteo Miotto Stat function in ggplot2: statistical transformations and more
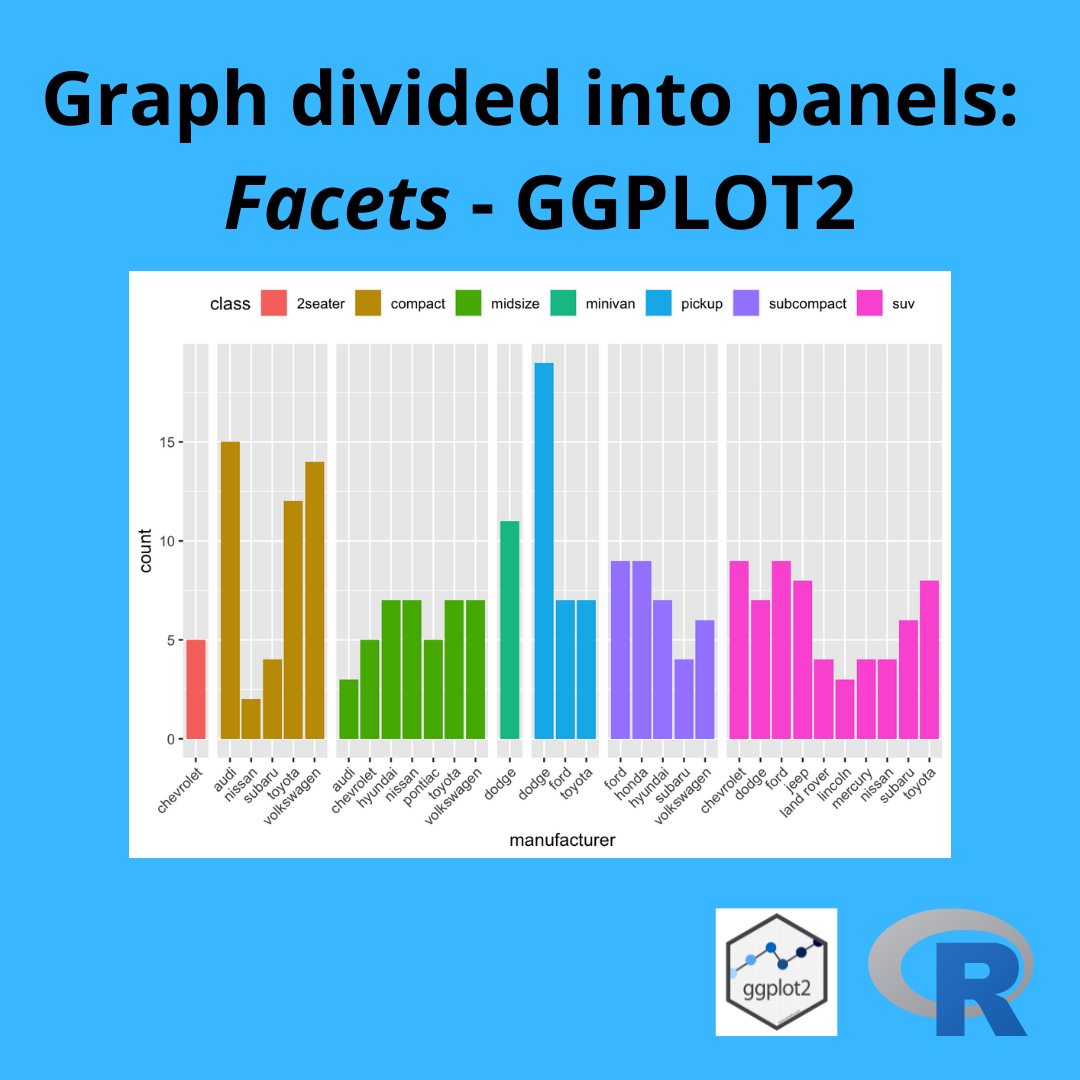
GGPLOT2 facets 📅 Apr 5, 2021 · 🕘 8 min read · 🤖 Matteo Miotto Facets function in ggplot2: how to split data into multiple panels
Introduction to GGPLOT2 📅 Mar 18, 2021 · 🕘 4 min read · 🤖 Matteo Miotto Introduction to an advanced graphic package
R environment commands 📅 Mar 14, 2021 · 🕘 3 min read · 🤖 Matteo Miotto List of useful commands to manage R environment